by Ashley Turrell, membership and analytics director
MAPP
 On average, manufacturers are spending $1 million per year to offer benefits to their employees, according to a recent report by the Manufacturers Association for Plastics Processors (MAPP) and the Association for Rubber Products Manufacturers (ARPM). The two associations jointly published the 2019 Health and Benefits Report. Data for this report came from a biennial
 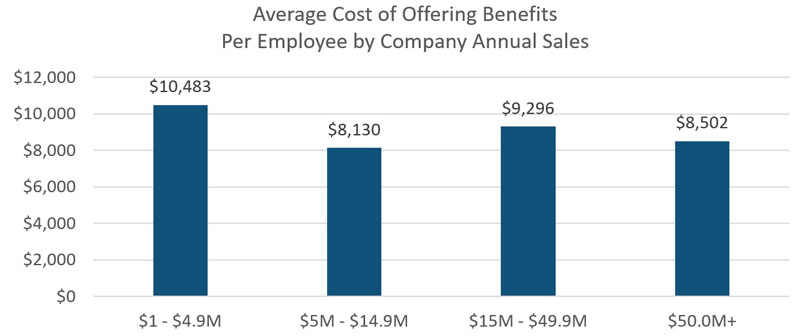 survey of plastics and rubber manufacturers in the US. The final report provides manufacturers with detailed information on health insurance plans, including premiums, employee contributions, employee participation and ancillary benefit programs.
The 2019 report includes input from 194 plastics and rubber manufacturers located across 33 states. The majority of participants were human resource representatives from mid-sized manufacturing organizations. The data represent more than 38,000 participating employees.
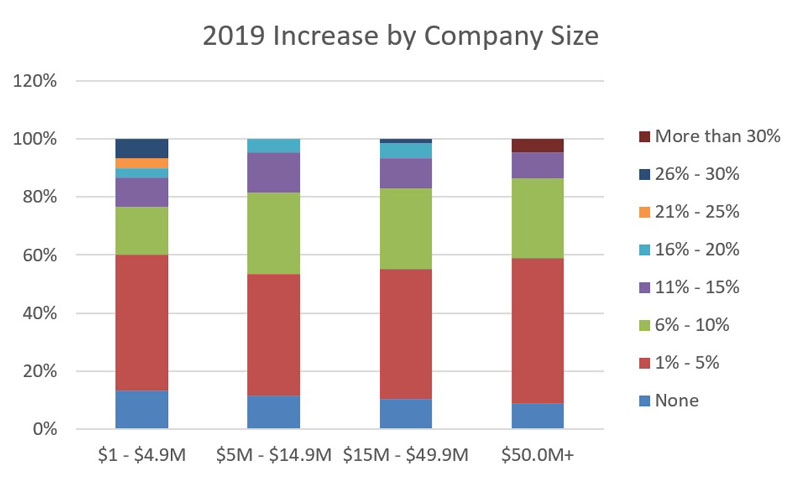
Overall, 99% of all organizations offered health insurance to their employees in 2018, with an average of 70% of employees participating in these plans. On average, participating companies spend $1,000,776 to offer benefits to their employees – or approximately $8,850 per participating employee. The cost of offering benefits continues to rise for employers. In 2018, 80% of manufacturers reported an increase in their health insurance costs. While 59% of manufacturers indicated their 2018 increase was between 1% and 10%, 6% of participants felt increases upwards of 21%. Additionally, 88% of companies have either already received or anticipate an increase in 2019.
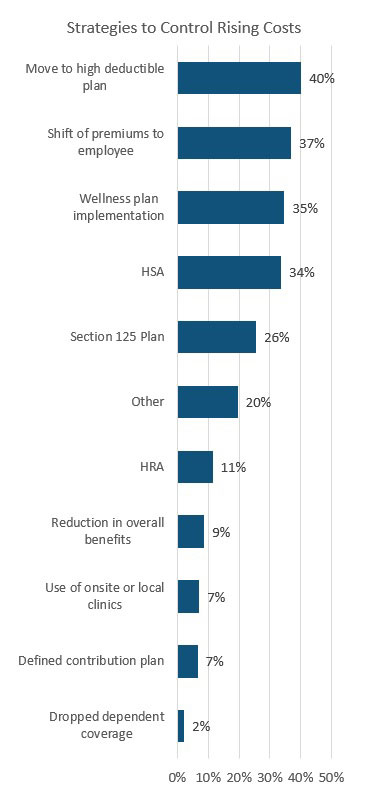
This year’s survey asked manufacturers to select all the strategies their organizations are implementing in order to control costs. The most common ways companies are attempting to control costs included moving to a high-deductible plan (40%), shifting premiums to employees (37%), implementing an employee wellness plan (35%), offering a Health Savings Account (34%) and utilizing a Section 125 plan (26%). Other cost-controlling tactics included a spousal surcharge, shifting from fully insured to self-insured, a tobacco usage surcharge and joining a manufacturing trust or Multiple Employer Welfare Arrangement (MEWA).
In terms of plans offered, Preferred Provider Organization (PPO) is the most common. PPO plans are offered by 74% of participants. Other common plan types included High Deductible Health Plan (42%) and Health Maintenance Organization (24%). The least common plan types include Point of Service (POS), traditional and Consumer-Directed Health Plan (CDHP). In terms of funding type, the majority of organizations still utilized a fully insured health insurance program, with 69% of organizations reporting this plan type. However, the larger the organization, the more likely it is to offer self-insured plans. For instance, only 15% of small manufacturers utilize a self-insured plan, while 64% of large organizations do the same.
 Manufacturers continue to offer more than just health insurance – the majority offer ancillary benefits as well. Overall, participating organizations reported offering dental (96%), vision (88%), employee life insurance (95%) and dependent life insurance (60%).
According to this year’s report, 93% of organizations also offered a retirement program to their employees. The most common retirement program offered is a 401(k), which is offered by 87% of manufacturers. The amount matched by organizations to employees’ retirement account ranged from no match to 100% match, but most companies commonly match 3% to 4%.
Participating organizations also reported other benefits provided to employees, including gain sharing programs, funeral leave, medical reimbursement, referral bonuses, childcare, company loans, legal assistance, and health and fitness coaching. Manufacturers know that keeping talent includes offering an attractive and competitive health and benefits program.
More information:www.mappinc.com