
by Rachael Pfenninger, director of strategic execution, MAPP
According to an article published by the American Medical Association in 2020, healthcare spending in the United States increased by 4.6% in 2019 – a percentage that was on par with 2018 growth and slightly faster than what was observed in 2017.¹ What is most remarkable, however, isn’t that healthcare spending is increasing – it’s that of healthcare spending around the world, the US is the worst performer. In fact, the US accounts for more than 40% of all global health spending, and today has seen healthcare spending hit almost 20% of total US GDP.²
While startling, this information doesn’t necessarily mean that Americans are using more healthcare than other countries. Rather, healthcare users in the United States simply are paying more per interaction.
These statistics are reflective of recent information collected by the Manufacturers Association for Plastics Processors (MAPP) in its 2022 Health and Benefits Report, where manufacturers continued to report rising costs. Of the 182 plastics processors that participated in this benchmarking effort, four in five received some increase in their health insurance costs in 2020 and received another increase again in 2021 – percentage increases that were difficult to swallow, especially given that respondents reported that the provision of health benefits now represents an average of 15% of corporate overhead.
Similarly, survey respondents also felt the pinch in increasing average costs for participating employees – while the average cost of medical benefits per participating employee in 2020 was $10,463, that cost rose to $11,026 in 2021.
These numbers are significant, especially because only 3% of survey respondents reported that they don’t currently offer health insurance to their employees. This makes the challenge of healthcare costs a largely universal one, felt equally by plastics processors regardless of annual sales revenue or employee count. In fact, when looking at the average enrollment of participating employees across annual sales ranges, nearly all revenue ranges had an average enrollment of at least two out of three employees (the only exception being companies under $3.49M).
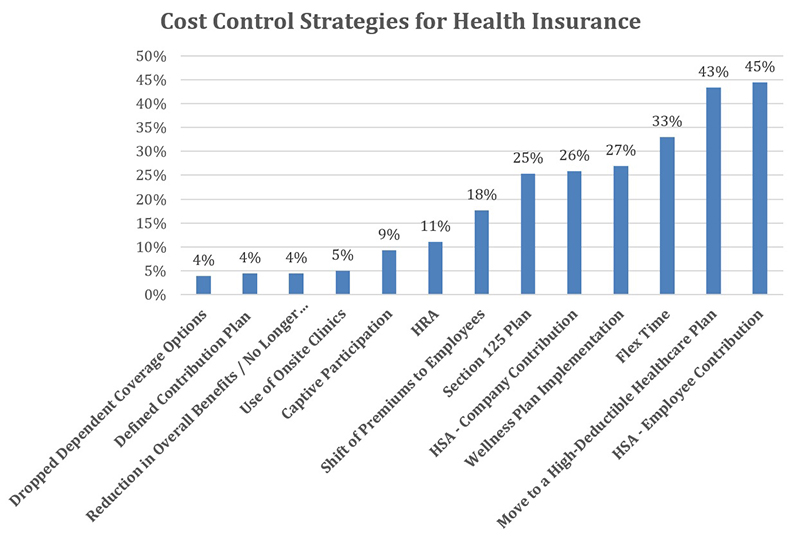
Although it may seem like there is no end in sight to these continued year-over-year increases, many manufacturers are exploring other cost-containment methods. Of the options provided, the most popular cost-control strategy identified by this survey’s respondents was the use of an employee contribution-oriented health savings account (HSA). This method – utilized by 44% of respondents – was followed by another 43% who have moved to a high-deductible health plan and a third of respondents who offer flexible spending accounts. Other cost-control strategies worth noting are the 15% or more of respondents who are providing an HRA health insurance plan, shifting premiums to employees, implementing wellness plans and/or participating in captives.
 In addition to the cost-control strategies cited above, this survey data also pointed to another, less easily identifiable opportunity – the willingness of executives and their teams to educate themselves on how their dollars are being spent. For example, when asked how much of their current medical spending went to Rx, only 20% of plastics processors were able to provide the information. Of all the cost containment strategies identified, the highest percentage of respondents – 47% – simply chose “Unknown.” And finally, when asked whether the company has a resource that provides long-term strategic guidance related to health benefits renewal, only two in three respondents replied with certainty that they know where they’re headed… meaning the other 32% of respondents rely on little to no strategic guidance at all.
Although the cost of healthcare is a challenge in and of itself, the data in this report also points to other bottom-line impacting information; specifically, what companies can offer to actively address growing workforce challenges. For example, 64% of plastics processors offer an employee assistance program (EAP), followed by 35% who participate in profit sharing (a motivating business model that can empower and drive one’s workforce).
Other benefits focus specifically on time management, family balance and/or healthy living; for example, while one-third of respondents provide flex time, 30% offer maternity leave and a quarter offer unpaid paternity leave and reimbursement for healthy living. There also is a strong focus on education, training and the development of one’s career path, which is clearly illustrated by the 74% of respondents who offer tuition reimbursement.
In none of these cases are 100% of this survey’s respondents providing the benefits listed above, which means that for any individual facility, adding any as an offering could be a significant employee benefit that not only drives down healthcare cost, but creates a healthier – and happier – workforce.
To benchmark healthcare policies related to both medical and ancillary benefits, gain a better understanding of cost control strategies, explore workforce opportunities and more, visit the Benchmarking Hub on www.mappinc.com to review and purchase the 2022 Health and Benefits Report.
MAPP members interested in decreasing their own healthcare costs also are encouraged to visit www.mappinc.com to learn more about the captive solution offered by MAPP’s leadership and the First Resource team.