
By Troy Nix, executive director, MAPP
From Holding Pattern to Cautious Growth
A year ago, plastics processors were bracing for impact. The 2025 MAPP Benchmarking Report captured an industry coming off two straight years of falling revenue, with median earnings before interest, taxes, depreciation and amortization (EBITDA) sliding to 6.8%, capacity utilization stuck near 52% and only about a third of molders adding people. Tariff policy had rocketed to the top of the worry list, and most companies expected revenue to shrink another 4.7% before year-end.
The 2026 report, built on 2025 financials and mid-2026 sentiment from 117 MAPP facilities, tells a different story. Margins have recovered, hiring has returned and optimism is at its highest level in several years. But the recovery is uneven, and the data shows exactly where the gains came from and where they are at risk.
A note on the data: The 2026 study conducted by Wipfli surveyed 456 manufacturing facilities across several sectors, and the report uses “all manufacturing” to mean that full group. Plastics processors are the largest single segment at 25%, followed by metalformers at 22%, with the rest made up of suppliers, gears and bearings, mold building, fasteners, assembly and other processes. The study also breaks out 117 MAPP facilities, 86% of which are injection molding companies. Unless noted otherwise, the figures in this article come from that plastics-specific data; where an all-manufacturing figure is cited, the article says so accordingly.
For plastics leaders, the message is clear: the market has turned, but the plastics processors that win the next cycle will be those that convert renewed demand into disciplined margin, not just more volume.
Profits Rebounded, But the Gap is Wide
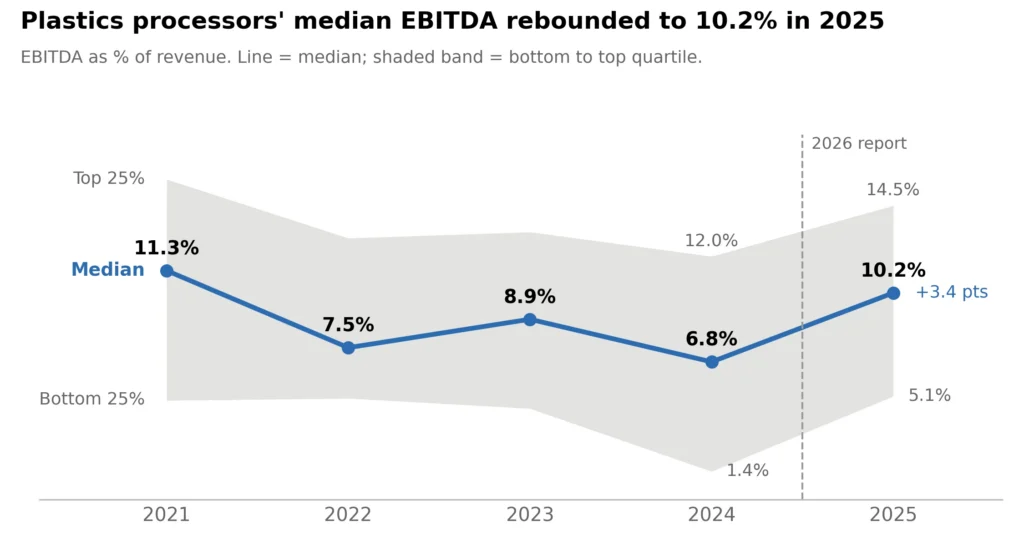
The headline is margin recovery. Median EBITDA for plastics processors climbed from 6.8% in 2024 to 10.2% in 2025, the best result since 2021 (Figure 1). Median EBIT reached 5.3%, and even the bottom quartile moved well off breakeven.
The gain did not come from efficiency. Median throughput, or value-added revenue per employee, essentially was flat at about $119,000. Instead, molders tightened their cost structure: Selling, general and administrative expenses (SG&A) as a share of revenue declined across all process types, and scheduled downtime fell sharply. That is good discipline, but it is a lever that can only be pulled so many times before the law of diminishing returns kicks into play.
The spread between leaders and laggards remains wide. Plastics processors make up 43% of the study’s top performers, who earned a median 11.3% EBIT. At the same time, 38% of all respondents now carry high debt relative to earnings, up from 28% in 2023, which leaves less room to absorb the next cost shock.
Demand and People: The Mood has Flipped
Every mid-year indicator for plastics processors moved in the right direction from 2025 to 2026, but not by the same amount. Hiring and confidence surged; actual press utilization barely budged. That gap matters. At 55%, utilization remains among the lowest in any manufacturing group type, and processors expect only 59% by year-end (Figure 2).
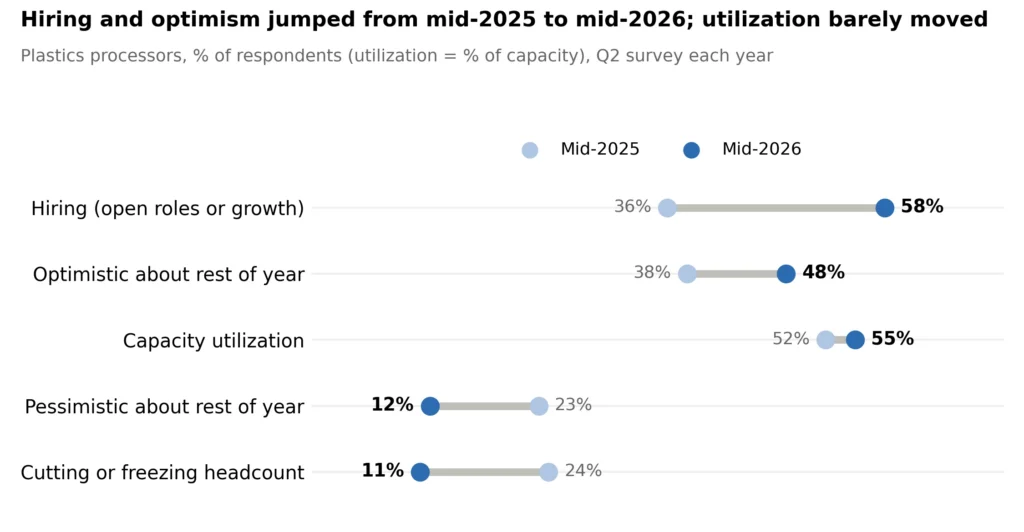
Confidence also is softening: plastics sentiment dipped from the first quarter of 2026 to the second, even as it remains well above prior years. Much of today’s hiring is backfilled, with more molders filling open positions than hiring for growth.
The labor market itself has eased. Across respondents, average days to fill a position fell from 58 to about 33. Retention, however, is a growing problem. Plastics processors’ hourly turnover ran 28% to 39% depending on company size, above the all-manufacturing average. Across all manufacturers, non-management wages rose about 4.3%.
Leadership succession is the quieter risk. More than half of owners across the study are 60 or older, yet only 30% have a formal exit plan.
Costs, Tariffs and the Plant Floor
The top concerns have shifted from policy to price. In 2025, trade and tariff policy dominated. In 2026, across all manufacturers, raw material pricing, higher costs of doing business and inflation led the list, as material costs as a share of revenue rose for processors in 2025. Worse yet, many companies report the inability to fully pass increases through to end customers.
Tariffs have generated more activity than business. Among plastics processors, 44% report more quoting in North America, but only 13% report more awarded work. OEMs are testing the market, but not moving programs as rapidly as desired by domestic manufacturers. Meanwhile, processors expect to source only about half of their molds in North America in 2026, down from more than 60% in 2021-2022. For molds, lower upfront cost still outweighs freight, duty and geopolitical issues for many buyers.
On the plant floor, uptime improved from 58% in 2024 to 61% in 2025, largely because scheduled downtime fell from 20% to 15%. But unscheduled downtime rose from 13% to 16%, and plastics processors still post the lowest uptime of any manufacturing group type in the study. Total cost of quality runs above 4% of revenue, with internal scrap and rework contributing to the largest controllable piece.
Complexity is the hidden tax; the hidden strain on profitability. Low-complexity facilities, those with fewer molds, resins and SKUs, earned a 7.6% EBIT and $143,000 in throughput per employee. Mid- and high-complexity shops earned 3.4% to 4.5%. The $20 million to $40 million molder often is caught in the middle, carrying the most molds and resins relative to its overall size.
What Plastics Leaders Should Do Next
The 2025-to-2026 shift says the industry has moved from protecting the business to rebuilding it. Five priorities stand out from the data.
- Price for today’s costs, not last year’s. Review input costs monthly and machine rates more than once a year. Margin recovered in 2025, but material inflation and incomplete pass-throughs can quickly and unknowingly erase it.
- Attack unscheduled downtime and scrap. With uptime at 61% and quality costs above 4% of revenue, the cheapest capacity a molder can add is the capacity it already owns.
- Simplify before growing. Rationalize resins, retire dormant molds and prune low-margin SKUs – a routine that should be conducted at least annually. The low-complexity shops in this study earned roughly twice the EBIT of their more complex peers, so caution is necessary when adding new work. Ensure it fits.
- Fix the front of the sales funnel. Treat tariff-driven quote requests with skepticism, qualify opportunities against ideal customer profiles and start tracking churn. Nearly half of processors do not measure the revenue they lose each year.
- Plan the people side now. Hiring is back, but a molder’s hourly turnover runs 28% to 39%, and many owners are approaching exit without a formal succession plan. Retention, knowledge transfer and leadership succession now are growth strategies, not human resources projects.
The plastics industry is heading into 2027 with more momentum than it has had since the post-pandemic peak. The companies that will lead it are the ones that treat this upturn as a chance to get leaner and more disciplined, not simply busier.
To obtain the 2026 MAPP Plastics Benchmarking Report, powered by Wipfli, visit www.mappinc.com/resources/benchmarking-publications/.
Sources
2025 and 2026 MAPP Plastics Benchmarking Reports, powered by Wipfli (2025 edition with Harbour IQ). The two surveys drew on different respondent groups, so year-over-year comparisons are directional.